.png?width=444&height=266&name=Student-support%20(1).png)


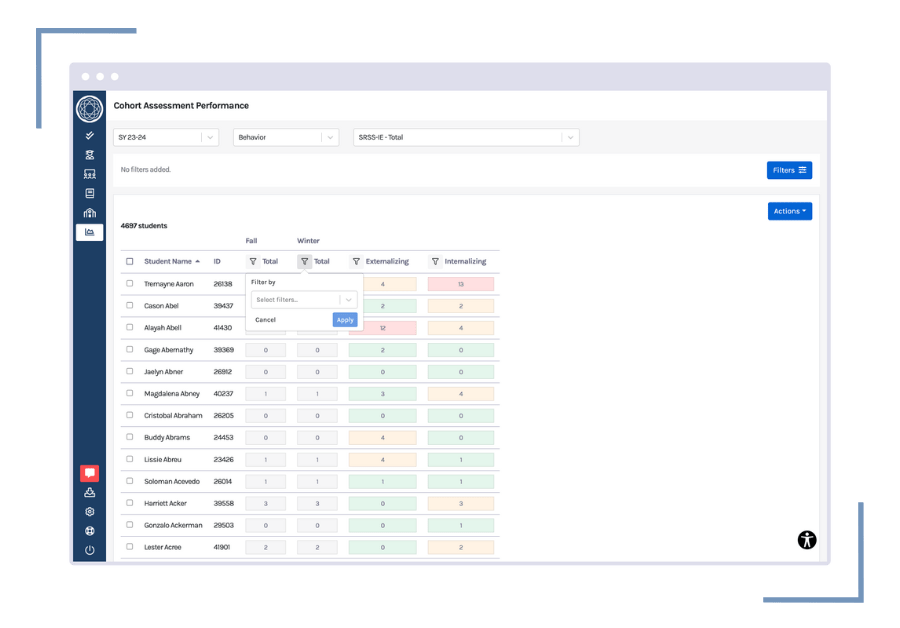
Identifying students’ tier level of support is an integral part of any Multi-Tiered System of Support (MTSS) framework. Not only does it help educators know which students require targeted and intensive intervention plans, but it also provides insight into the health of a district or school’s MTSS practice. When leaders have visibility into the proportion of students at each tier level and how students are moving across levels of support, they can identify gaps and develop strategies to strengthen their intervention approaches.
Although this process may seem straightforward, educators implementing MTSS often find themselves in scenarios where they are uncertain how to proceed. Here is a brief overview of tier levels and how to address common issues.
Tiering in MTSS
The most common MTSS framework consists of three tier levels:
Tier 1 is the universal support provided to all students at the classroom level.
- Tier 1 includes curricula, strategies, programs, and practices that are part of core instruction and differentiated approaches to support all students in the classroom.
- Tier 1 also includes behavior support provided to all students, such as clear expectations, intentional structure, classroom management, and a school climate that encourages positive behavior and consistent attendance.
- Effective schools strive to have a Tier 1 system that adequately supports the growth and learning of at least 80% of their student population, reserving intervention resources for those students who truly need additional support.
Tier 2 support is designed for students who fall below specific benchmarks or cut-points, indicating that they need additional help to meet grade-level expectations.
- When core instruction is strong, it is typical for around 15% of students in a school to require this additional level of support.
- Tier 2 interventions are provided in small groups of students with similar skill gaps, usually 2-3 times a week, along with regular progress monitoring.
💡TIP: It’s important to note that students receiving Tier 2 support continue to participate in the core curriculum with their classmates. Interventions are in addition to, not in place of, core instruction.
Tier 3 support is individualized for students who are struggling significantly in one or more subject/skill areas and require much more intensive support to be successful.
- When core instructions and strategic interventions are provided with fidelity, most school find around 5% of students who need support at this level.
- These students often require multi-component intervention plans, weekly progress monitoring, and wraparound support across different contexts to help improve their learning and growth.
💡TIP: Students with Tier 3 support should also participate in the Tier 1 core curriculum. Just like Tier 2, intensive Tier 3 support is provided in addition to typical grade-level content.
📚Read more: What Do the Tiers Mean in MTSS?
Scenario 1: Flipped Pyramid
Many districts serving high-risk populations encounter a challenge where the distribution of students across tiers does not reflect the typical MTSS framework. Instead, the majority of students fall into Tier 2 or Tier 3, creating an inverted pyramid. This misalignment presents a significant problem for schools that lack the capacity to provide intensive interventions for a large portion of their student body.
Recommendations for Addressing an “Upside-Down Triangle”:
1. Examine Tier 1 Curriculum and Instructional Practices
- Begin by assessing the effectiveness of your Tier 1 core curriculum and identifying any gaps that may contribute to student underperformance.
- Ensure that teachers are implementing the curriculum with fidelity, as delivery quality can directly impact student outcomes.
- Use data to identify trends or patterns that may point to weaknesses in Tier 1 instruction.
For example, if universal screening reveals that a high percentage of early elementary students struggle with reading fluency. It may be necessary to reallocate instructional time to this area across all classrooms.
2. Expand Tier 2 Support Flexibility
- Group students with similar academic struggles at the same grade level to provide more targeted interventions. Aligning instructional schedules across a department can help teachers work together to group and support students with skill gaps.
- Implement ongoing progress monitoring within these groups to track student responsiveness to interventions and identify those who may require more intensive support in Tier 3.
3. Use Tier-Level Data to Adjust Resource Allocation
- Analyze tier-level data across schools to allocate resources more effectively. Schools with higher proportions of students falling below proficiency may require additional interventionists or support staff.
- Provide targeted professional development for educators in schools experiencing an inverted pyramid, ensuring they have the skills and strategies to address the unique challenges they face.
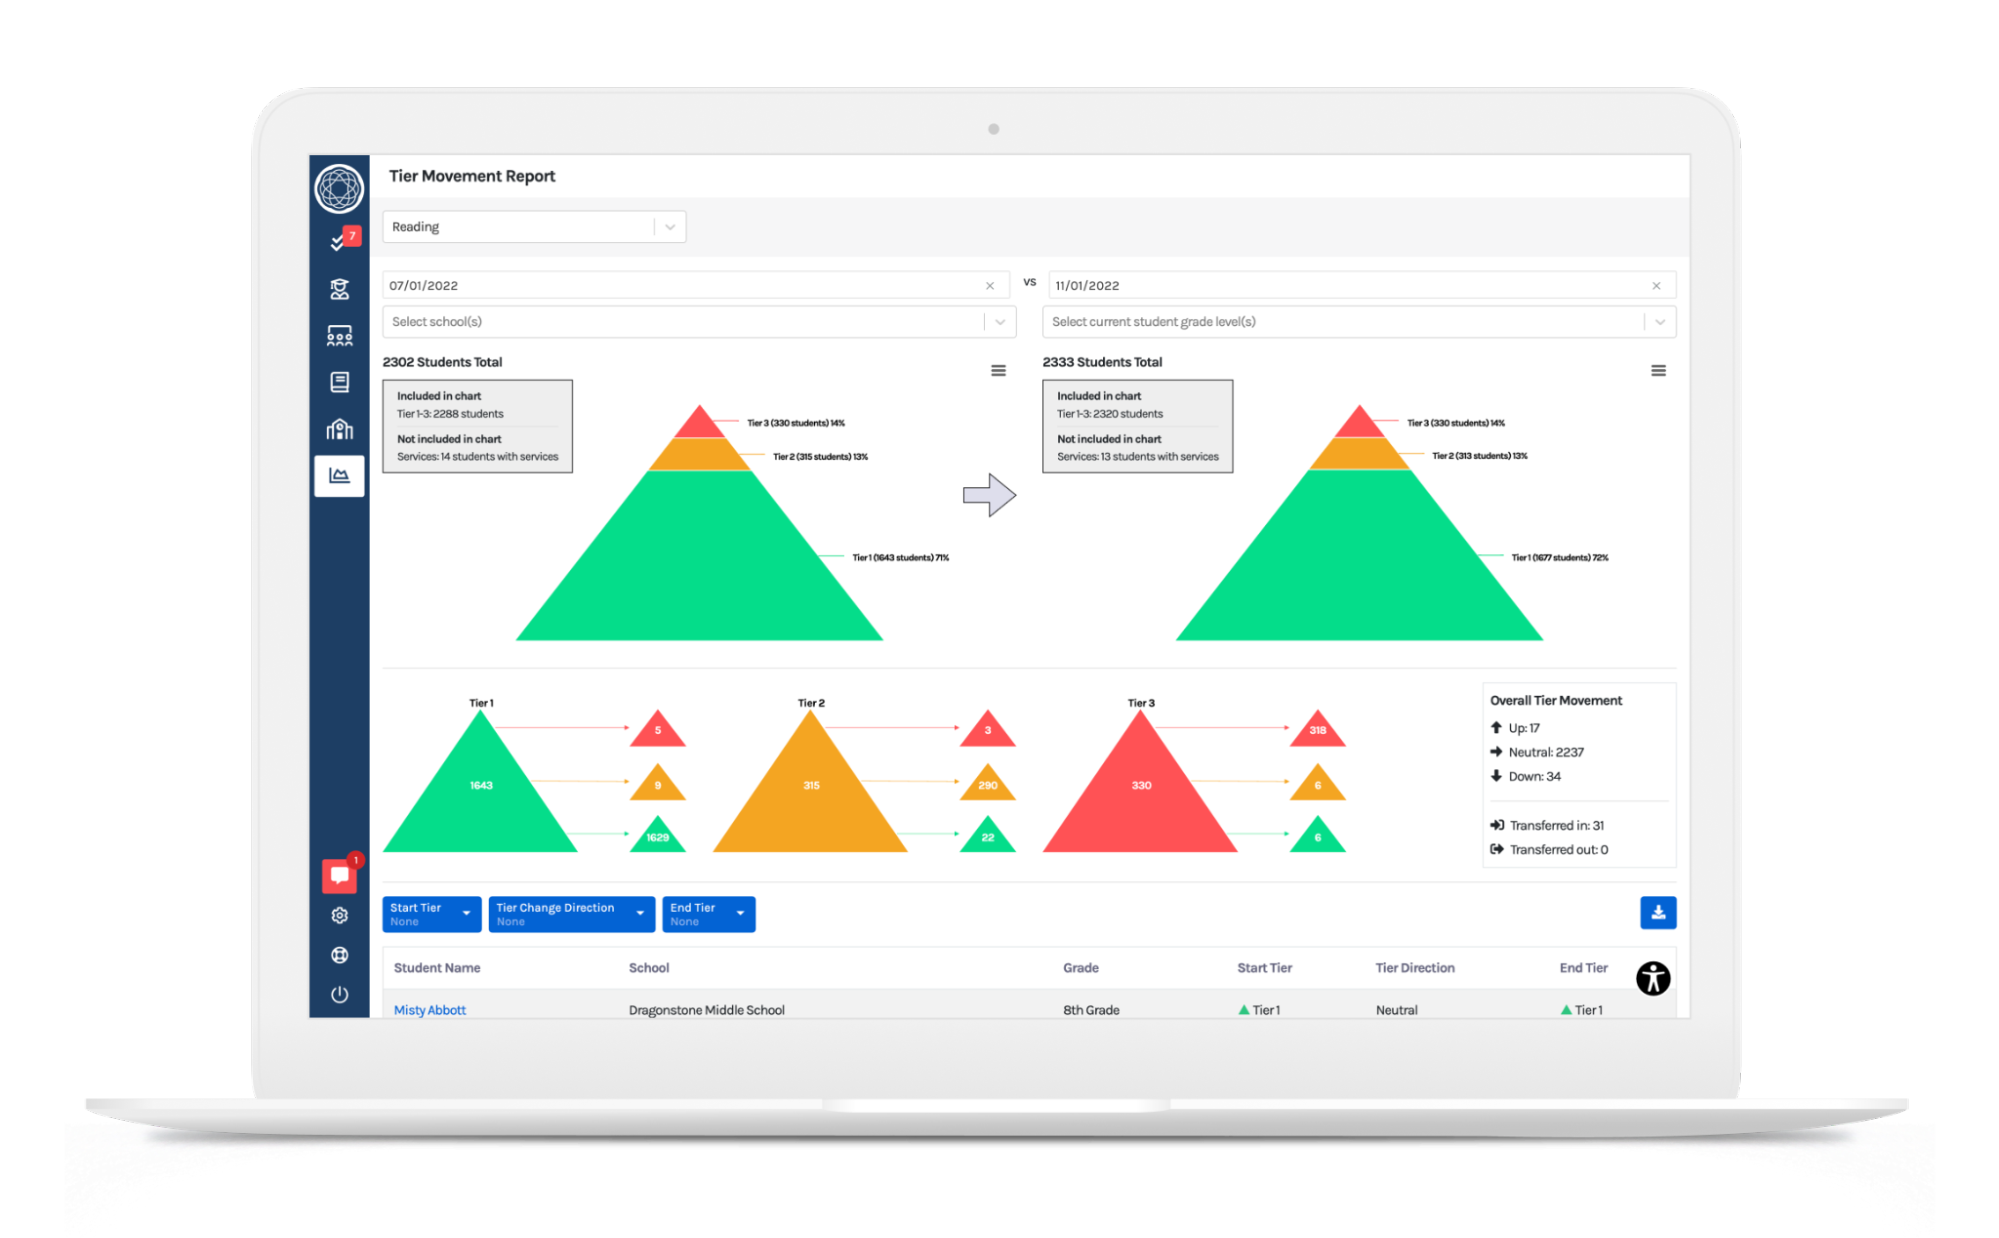
Scenario 2: Students Moving Up in Tier Levels
Tracking students' movement between tiers over time is essential for understanding their progress and determining how well their support needs are being met. In a well-functioning MTSS framework, students should ideally experience neutral or net downward movement between tiers, meaning they are progressing and needing less intensive support. However, some schools may notice a trend where more students are moving from less intensive tiers (e.g., Tier 2) to more intensive tiers (e.g., Tier 3), indicating potential issues.
A healthy MTSS practice will have students moving up and down in tier levels, with an overall pattern of neutral or net downward movement as students respond to intervention. However, some schools may notice more students moving from less intensive tiered support to more intensive tiered support (e.g., Tier 2 to Tier 3). If many students receiving Tier 2 support are transitioning to Tier 3 rather than moving to Tier 1, it may indicate that the Tier 2 interventions are not as effective as they should be.
Common Challenges to Consider:
Quality and Quantity of Tier 2 Support
- Review the quality and frequency of the interventions being provided. Are students receiving enough targeted support to address their needs?
Alignment of Interventions
- In some cases, students may appear to be unresponsive to an intervention because the intervention itself is not aligned with the specific skill deficit the student is struggling with.
Tier Placement Criteria
- Reexamine the criteria used to assign students to tier levels. It’s possible that students who should be receiving Tier 3 support are placed in Tier 2, meaning they are not receiving the higher level of support needed to progress effectively.
Recommendations for Tier Movement Concerns:
- Monitor Trends in Tier Movement: Regularly track the movement of students between tiers to identify any trends or patterns that suggest underlying issues.
- Assess Intervention Effectiveness: Evaluate the effectiveness of Tier 2 interventions and ensure they are delivered with sufficient intensity and precision to meet students' needs.
- Refine Tier Placement Processes: Review and update the criteria for placing students in tiers to ensure that students are receiving the correct level of support.
Scenario 3: Demographic Differences
Many schools find that the proportion of students receiving Tier 2 and 3 levels of support is not reflective of the demographic proportions of students who are identified by a screening assessment as needing support.
For example, some schools may notice that mainly students of color receive Tier 3 support. Other schools may see that students who are English Language Learners are not responding well to Tier 1 and 2 support compared to their classmates. These support disparities require a critical and honest evaluation to determine what could contribute to them. For example, they could be influenced by bias regarding expectations of students’ skills and abilities depending on their race, ethnicity, primary language, gender, or socioeconomic status. It’s also possible that the interventions and supports are not culturally responsive to the underserved population.
Next Steps for MTSS Success
Now is the time to critically evaluate your MTSS frameworks and intervention practices! Effective implementation of MTSS requires not only understanding how to identify the appropriate tier levels of support for students, but also continuously analyzing tier movement, demographic trends, and the quality of interventions provided.
Your tier-level data can help you identify gaps, realign resources, and ensure every student receives the support they need to thrive. Whether you’re addressing flipped pyramids, upward tier movement, or demographic disparities, your data can guide meaningful, data-driven decisions that improve outcomes for all students.

MTSS Shouldn't Be So Hard
Empower your team with actionable insights that drive success for your students, staff, and school(s).

.png?width=716&height=522&name=Understanding%20Literacy%20Basics%20(Preview).png)

.png?width=716&height=522&name=Tiers%20in%20Response%20to%20Intervention%20and%20Multi-Tiered%20System%20of%20Supports%20(preview).png)