.png?width=444&height=266&name=Student-support%20(1).png)


.png?width=318&height=279&name=Teams%20Edweb%20(6).png)


.png?width=1436&height=956&name=Top%205%20MTSS%20Collaboration%20Tips%20from%20Branching%20Minds%20(1).png)
In the dynamic world of education, certain terms come and go. Among them, "collaboration" could be brushed off as just another buzzword. However, effective collaboration is a fundamental practice in MTSS that drives student achievement and fosters a sense of community for staff. By cultivating a culture of effective teamwork, we create an environment where everyone works together with a common goal: to ensure student success. We’ve compiled our top five practical tips for effective team collaboration, showcasing how MTSS team best practices (with support from Branching Minds!) can significantly benefit educators and students.
Tip #1: Create a Team Structure that Works for your Campus
When establishing an effective Multi-Tiered System of Supports (MTSS), it’s essential to create a team structure that aligns with your campus's unique needs. Carefully explore overlaps and gaps in the team structure in order to use maximize efficiency. Some common team formats include:
- Academic leadership
- Behavioral leadership
- Grade level/Department
- Tier 2/3 Academic Intervention
- Tier 2/3 Behavior Intervention Team
- Student Support, Multi-Disciplinary Teams
Additionally, consider how teams will communicate with each other, creating streamlined lines of responsibility and communication. With a well-defined team structure in place, your MTSS efforts will thrive, benefiting both educators and students alike.
Tip #2: Get the Right People Around the Table
Before incorporating technology to support your MTSS practices, emphasize the importance of wide representation. Whose voices might be missing from your meeting table? Including perspectives like those of paraprofessionals, parents, and even students themselves provides invaluable insights and increases engagement. To foster a cohesive environment, provide clear descriptions and hold each team member accountable for their responsibilities. With the right people in place, your MTSS collaboration will be more efficient and effective, ultimately benefiting the academic and behavioral success of your students.
Tip #3: Create an MTSS Handbook with Your Team Structure and Procedures Written Down
Writing it down will ensure a well-defined team structure and clear lanes of responsibility. This process also helps avoid a frustrating duplication of work and reinventing the wheel each year with staff changes and new challenges. By creating a comprehensive handbook with a process for review and revision, campuses and districts can continually build and improve their system of supports.

TIP #4: Use a Problem-Solving Protocol Specific to Each Type of Meeting
Improving your meeting format can dramatically improve collaboration! This is as simple as having a set agenda and problem-solving protocol in place before the gathering. Each type of meeting you're attending, whether it's a school-wide oversight meeting, grade-level/department meeting, or individual student problem-solving session, requires a unique agenda and protocol.

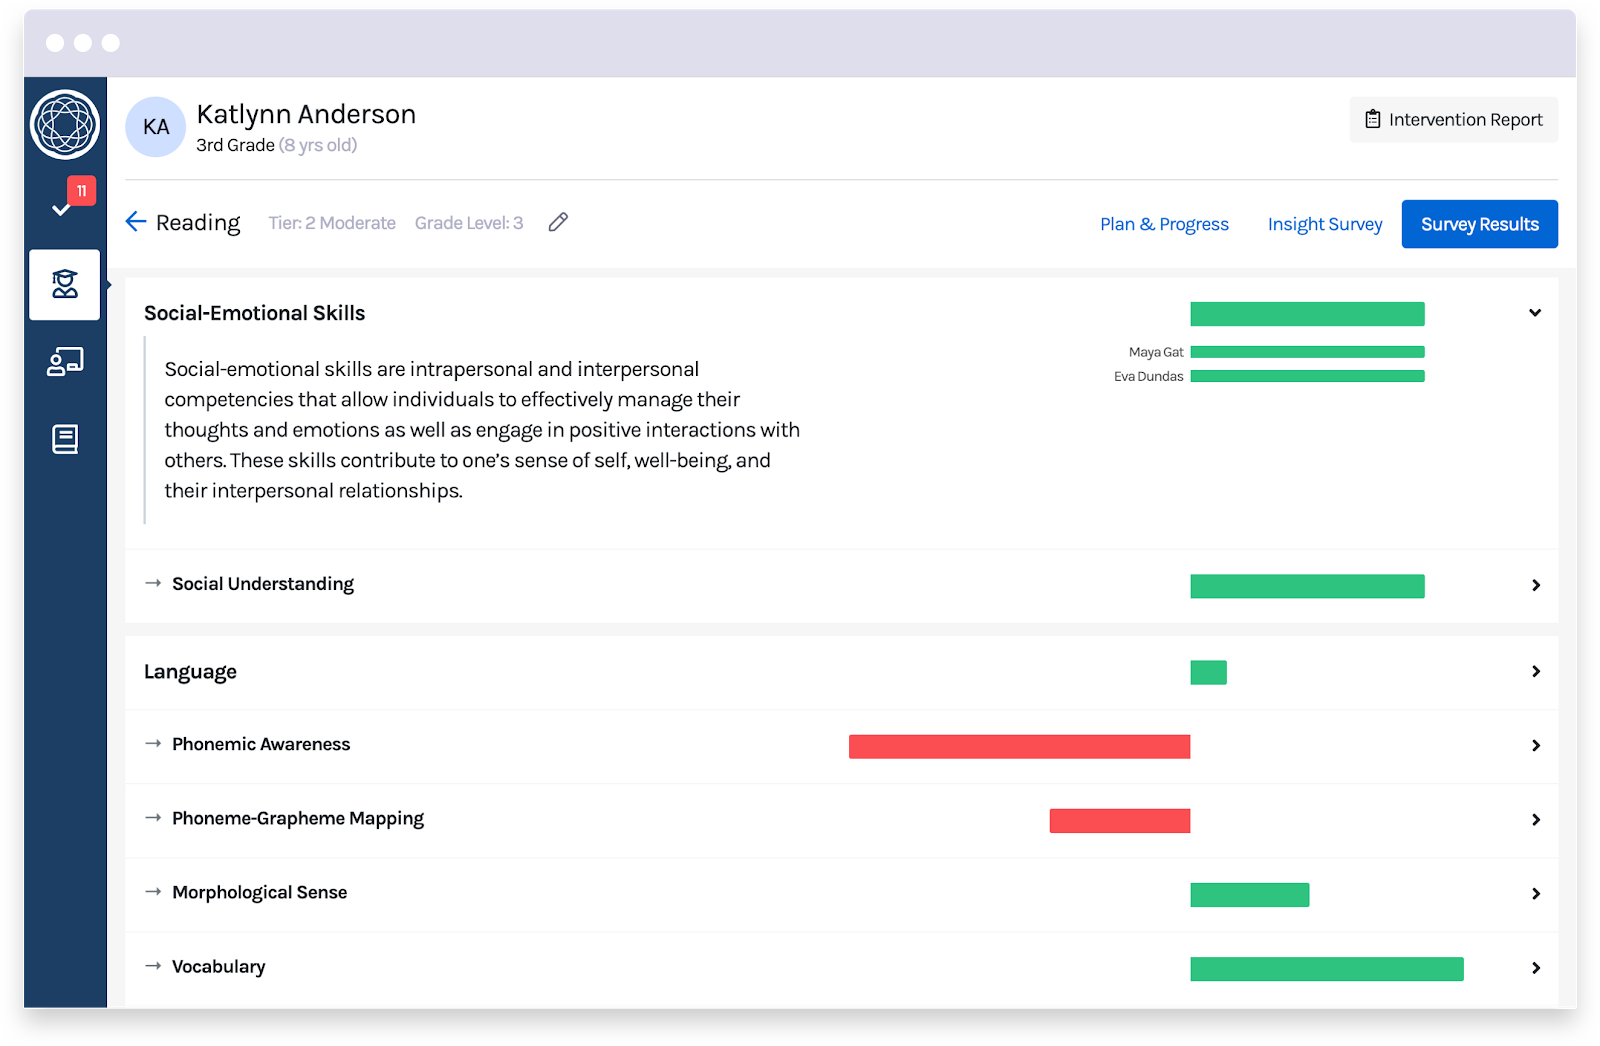
Tip #5: Ensure Data is Easily Collected and Reviewed Before the Meeting
The last thing we want to do is to slow down the collaborative work needed to help students succeed. As tempting as it is, let’s avoid the practice of “admiring the problem” when we gather to discuss student needs. To stay solution-focused, gather staff members ahead of meetings to help to uncover the reasons behind student struggles and keep the meeting focused on finding effective solutions.
Putting Collaboration Into Practice
Incorporating these practical strategies for collaboration can truly make a difference in your MTSS practice. As educators prioritize collaboration and ensure that everyone has the resources they need to succeed, they foster a community where staff and students thrive together.
.png?width=926&height=672&name=Meetings%20Guide%20(Cover).png)
Transform Your MTSS Meetings
Make every meeting a tool for meaningful collaboration and measurable outcomes. Learn more about the Branching Minds Meeting Assistant.

.png?width=716&height=522&name=3%20Things%20School%20Safety%20Teams%20Need%20to%20Be%20Effective%20(preview).png)
-1.png?width=716&height=522&name=Washingtons%20RTI%20Requirement%20for%20SLD%20Eligibility(preview)-1.png)
.png?width=716&height=522&name=Red%20Flags%20That%20Reveal%20a%20Disconnect%20Between%20MTSS%20and%20Special%20Education%20(blog).png)